

- Evaluation metrics tracking over time
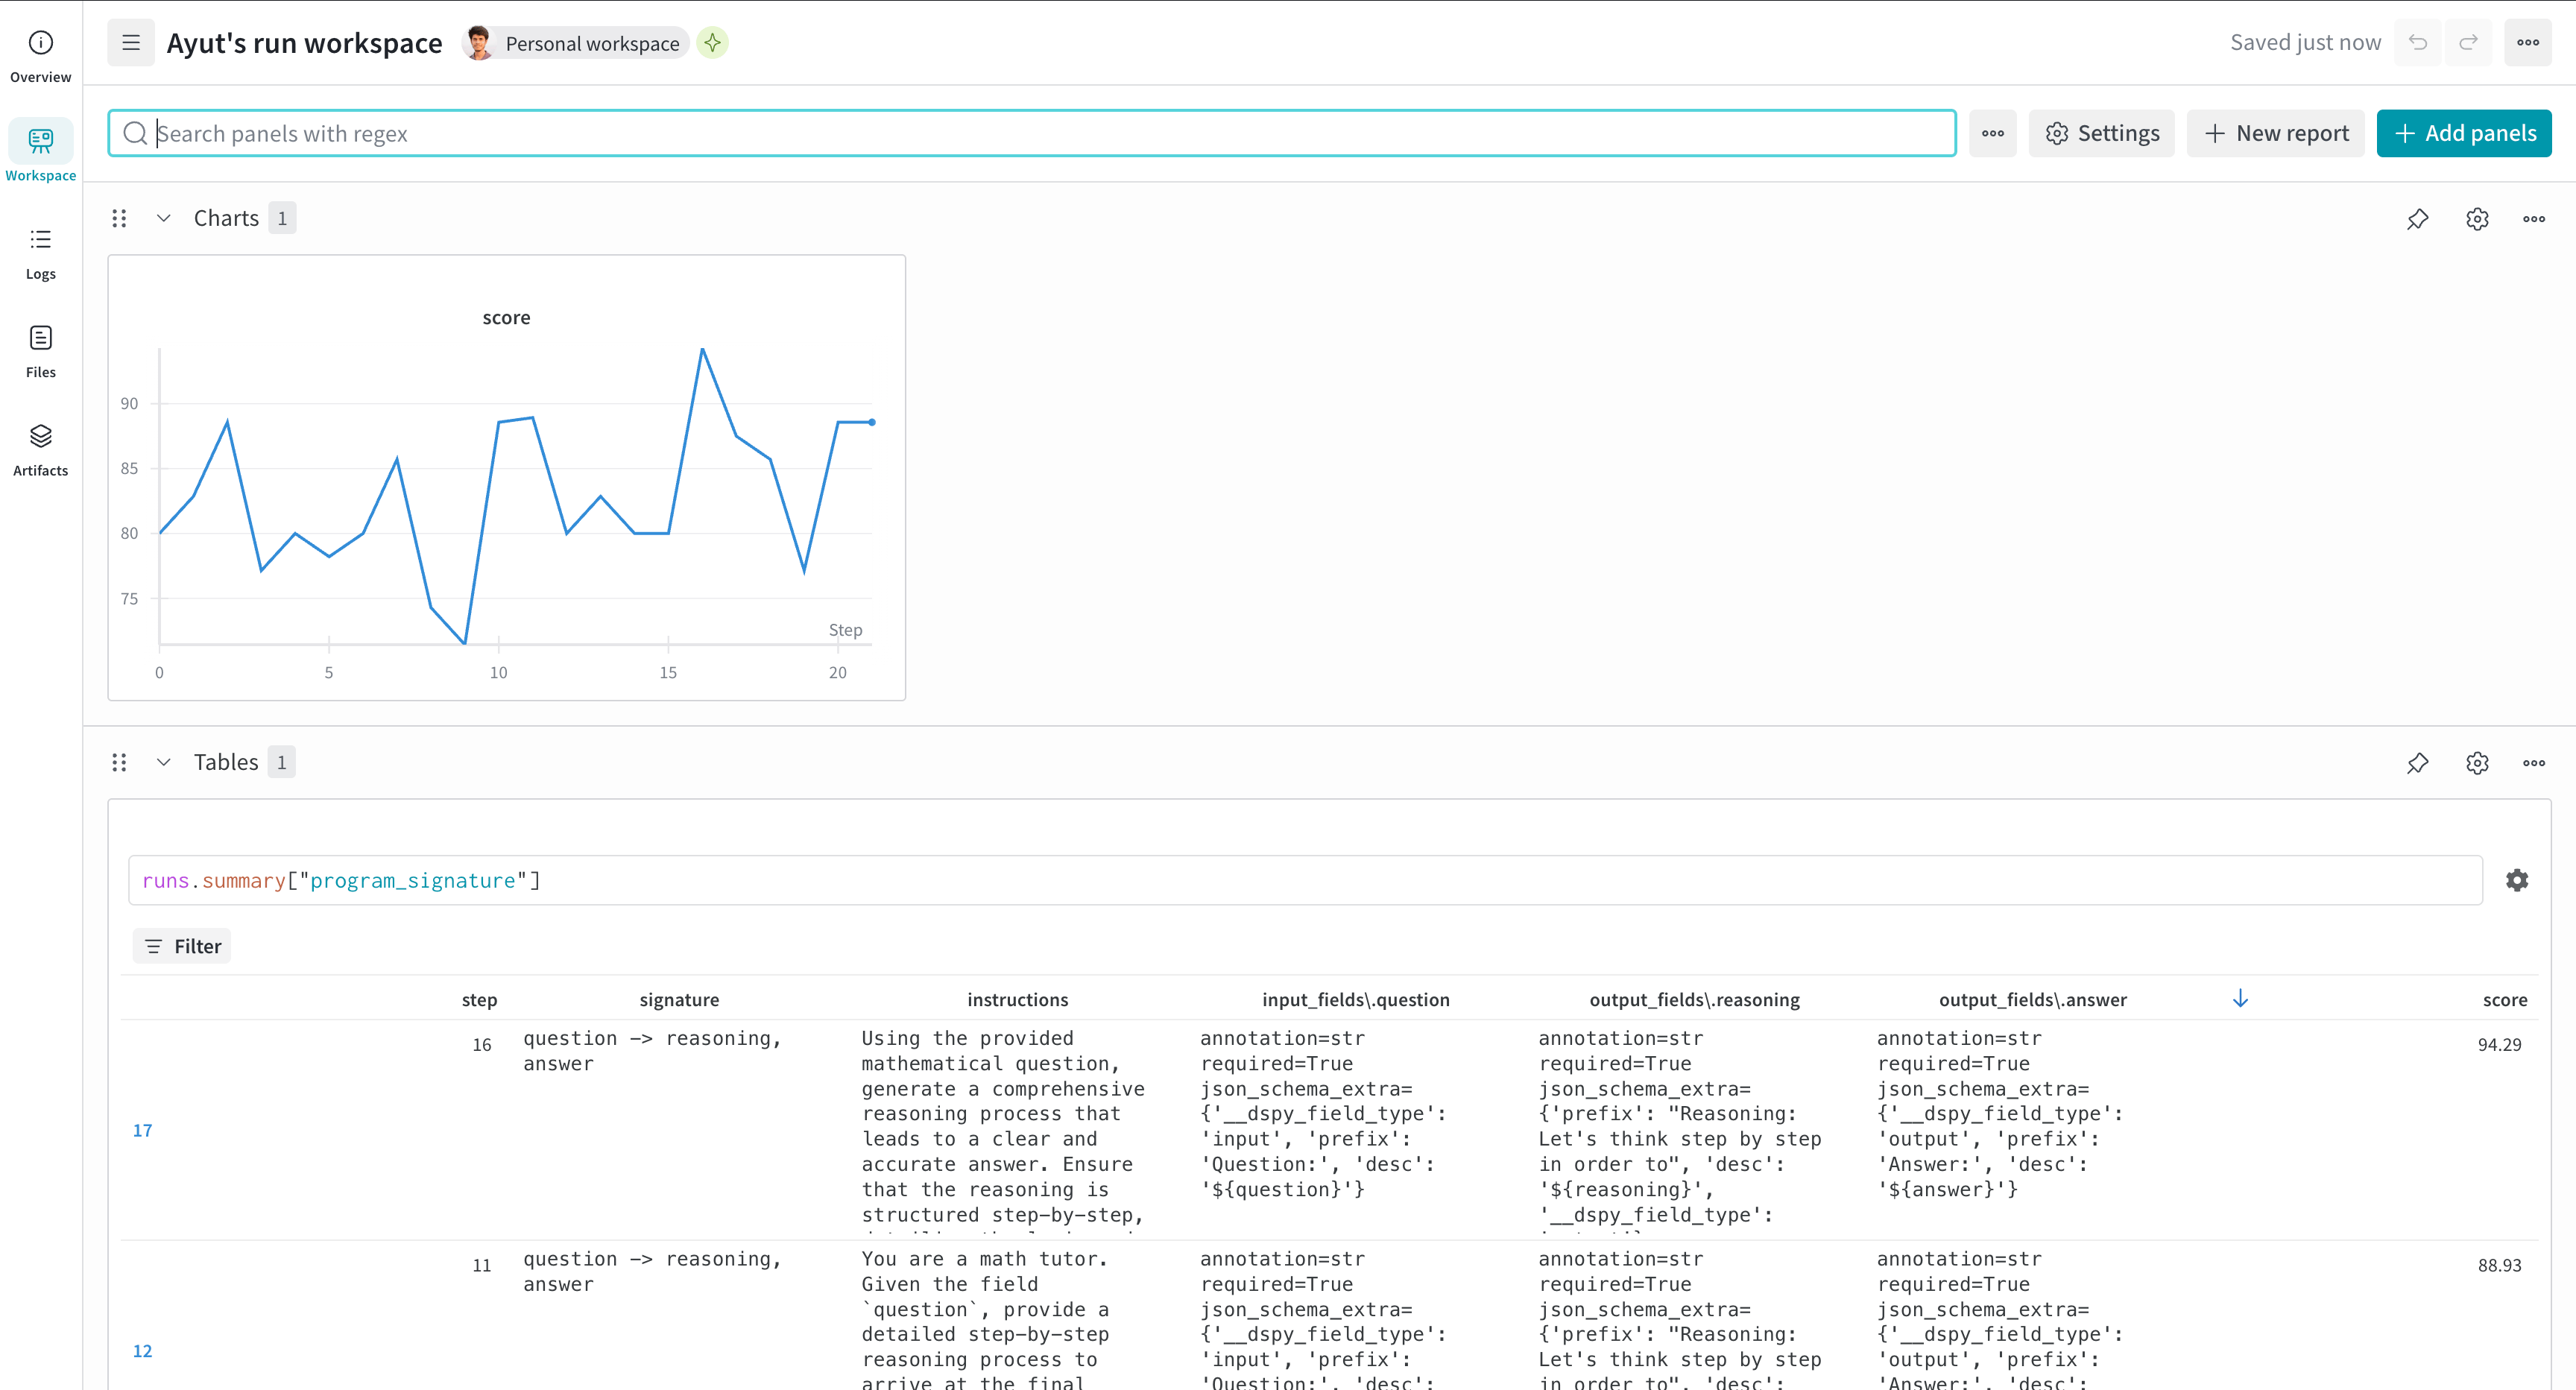
- W&B Tables for program signature evolution
- Integration with DSPy optimizers like MIPROv2
NoteAs of
wandb==0.21.2 and weave==0.52.5, Weave initializes automatically when used with W&B:- If
weaveis imported and thenwandb.init()is called (script case) - If
wandb.init()was called and thenweaveis imported later (notebook/Jupyter case)
weave.init(...) call is required.Install and authenticate
Install the required libraries and authenticate with W&B:- Command line
- Python
- Notebook
-
Install the required libraries:
-
Set the
WANDB_API_KEYenvironment variable and log in. Replace<your_api_key>with your W&B API key:
Track program optimization (experimental)
For DSPy optimizers that usedspy.Evaluate (such as MIPROv2), use the WandbDSPyCallback to log evaluation metrics over time and track program signature evolution in W&B Tables. Attaching the callback lets you observe how the optimizer’s score changes and how the program’s prompts and signatures evolve across iterations.
run object to WandbDSPyCallback, the callback uses the global run object.
Log predictions to W&B Tables
In addition to aggregate metrics, you can enable detailed prediction logging to inspect individual examples during optimization. The callback creates a W&B Table for each evaluation step, which helps you analyze specific successes and failures.Access prediction data
After optimization, find your prediction data in W&B:- Navigate to your run’s Overview page.
- Look for Table panels named with a pattern like
predictions_0orpredictions_1. - Filter by
is_correctto analyze failures. - Compare tables across runs in the project workspace.
example: Input dataprediction: Model outputis_correct: Evaluation result